Fusion Analysis
Introduction
IMPORTANT
The Fusion module focuses on single-cell transcriptome fusion gene detection analysis, combining the STAR-Fusion algorithm with single-cell transcriptome data to achieve cell-level fusion gene identification, visualization, and functional analysis. The workflow supports human and mouse species, enabling the identification of fusion events from raw fastq files or preprocessed data and their presentation at single-cell resolution.
Gene fusions play a crucial role in tumorigenesis, cell differentiation, and disease progression. The Fusion module on the SeekSoul™ Online cloud platform provides a comprehensive solution from raw data processing to result visualization, capable of accurately identifying fusion genes, evaluating their distribution across different cell populations, and providing detailed biological annotation information.
Theoretical Foundation of Fusion Analysis
Core Principles
- Data Preprocessing: Quality control and filtering of input fastq files to remove low-quality reads and adapter sequences, ensuring the accuracy of subsequent analysis.
- Fusion Gene Detection: Using the STAR-Fusion algorithm for fusion event identification, which combines the high sensitivity of the STAR aligner with a dedicated fusion filtering pipeline to effectively identify various types of gene fusions.
- Fusion Validation and Annotation: Verification of detected fusion events, assessment of their reliability, and provision of rich annotation information, including breakpoint positions, supporting read counts, fusion types, etc.
- Single-Cell Integration Analysis: Integration of fusion gene detection results with single-cell transcriptome data to identify cell populations carrying specific fusions.
- Visualization and Report Generation: Generation of UMAP/TSNE visualizations to intuitively display the distribution of fusion genes across different cell populations, along with HTML reports containing detailed analysis results.
Technical Features
| Feature | Description | Advantage |
|---|---|---|
| STAR-Fusion Algorithm | Based on the STAR aligner, efficiently identifies fusion transcripts | High sensitivity, low false positive rate |
| Single-Cell Resolution | Maps fusion events to specific cell populations | Provides cellular heterogeneity perspective |
| Multi-Species Support | Supports human and mouse genome analysis | Wide application range |
| Rich Annotation Information | Provides breakpoint positions, fusion types, functional annotations, etc. | Facilitates biological interpretation |
| Intuitive Visualization | UMAP/TSNE scatter plots showing fusion gene distribution | Facilitates result explanation and presentation |
Key Statistical Metrics
- JunctionReadCount: Number of reads that span the fusion junction site and can be split-mapped to both fusion genes.
- SpanningFragCount: Number of reads that span the fusion junction, with R1 and R2 ends corresponding to different genes.
- FFPM: Normalized result of fusion-supporting reads, i.e., fusion amount per million total reads.
- LargeAnchorSupport: Whether there are long base sequences (≥ 25) of reads matching on both sides of the assumed breakpoint; fusion genes lacking LargeAnchorSupport are typically false positives.
- PROT_FUSION_TYPE: Protein fusion type, such as INFRAME (in-frame fusion), etc.
SeekSoul™ Online Cloud Platform Operation Guide
Pre-Analysis Preparation
CAUTION
- Input data should be paired fastq files (R1 and R2), ensuring standardized file naming for the system to correctly identify sample information.
- Ensure the correct species is selected (human or mouse), as this affects the choice of reference genome and the accuracy of subsequent analysis.
- For large-scale data, it is recommended to perform data quality assessment first to ensure the data quality meets analysis requirements.
Parameter Details
| Interface Parameter | Description | Notes |
|---|---|---|
| Task Name | Starts with English, can include Chinese/numbers/underscores | Used for report header and task tracking |
| Sample Information | Input sample name, R1 and R2 fastq file paths | Supports parallel analysis of multiple samples |
| Species | human / mouse | Determines the reference genome used |
| Note | Custom text | Records analysis background information |

Result Interpretation
Result Directory Overview
| Path | Content | Description |
|---|---|---|
output/results/fusion/ | Raw fusion gene detection results | Contains STAR-Fusion output files |
output/results/plots/ | Fusion gene visualization charts | UMAP/TSNE scatter plots |
output/results/meta/ | Metadata information | Cell annotations and statistical data |
report/ | HTML report directory | Contains reports with complete analysis results |
Fusion Gene Table Interpretation
| Column Name | Description | Importance |
|---|---|---|
#FusionName | Fusion gene name. | Primary key identifier. |
JunctionReadCount | Number of supporting reads at junction site. | Assesses reliability. |
SpanningFragCount | Number of reads spanning fusion fragment. | Assesses reliability. |
LeftGene/RightGene | Two genes involved in fusion. | Foundation for functional analysis. |
LeftBreakpoint/RightBreakpoint | Fusion breakpoint positions. | Key for structural analysis. |
LargeAnchorSupport | Long anchor support status. | Important indicator for filtering false positives. |
FFPM | Normalized fusion read value. | Quantifies expression level. |
PROT_FUSION_TYPE | Protein fusion type. | Basis for function prediction. |
Key Figure Examples
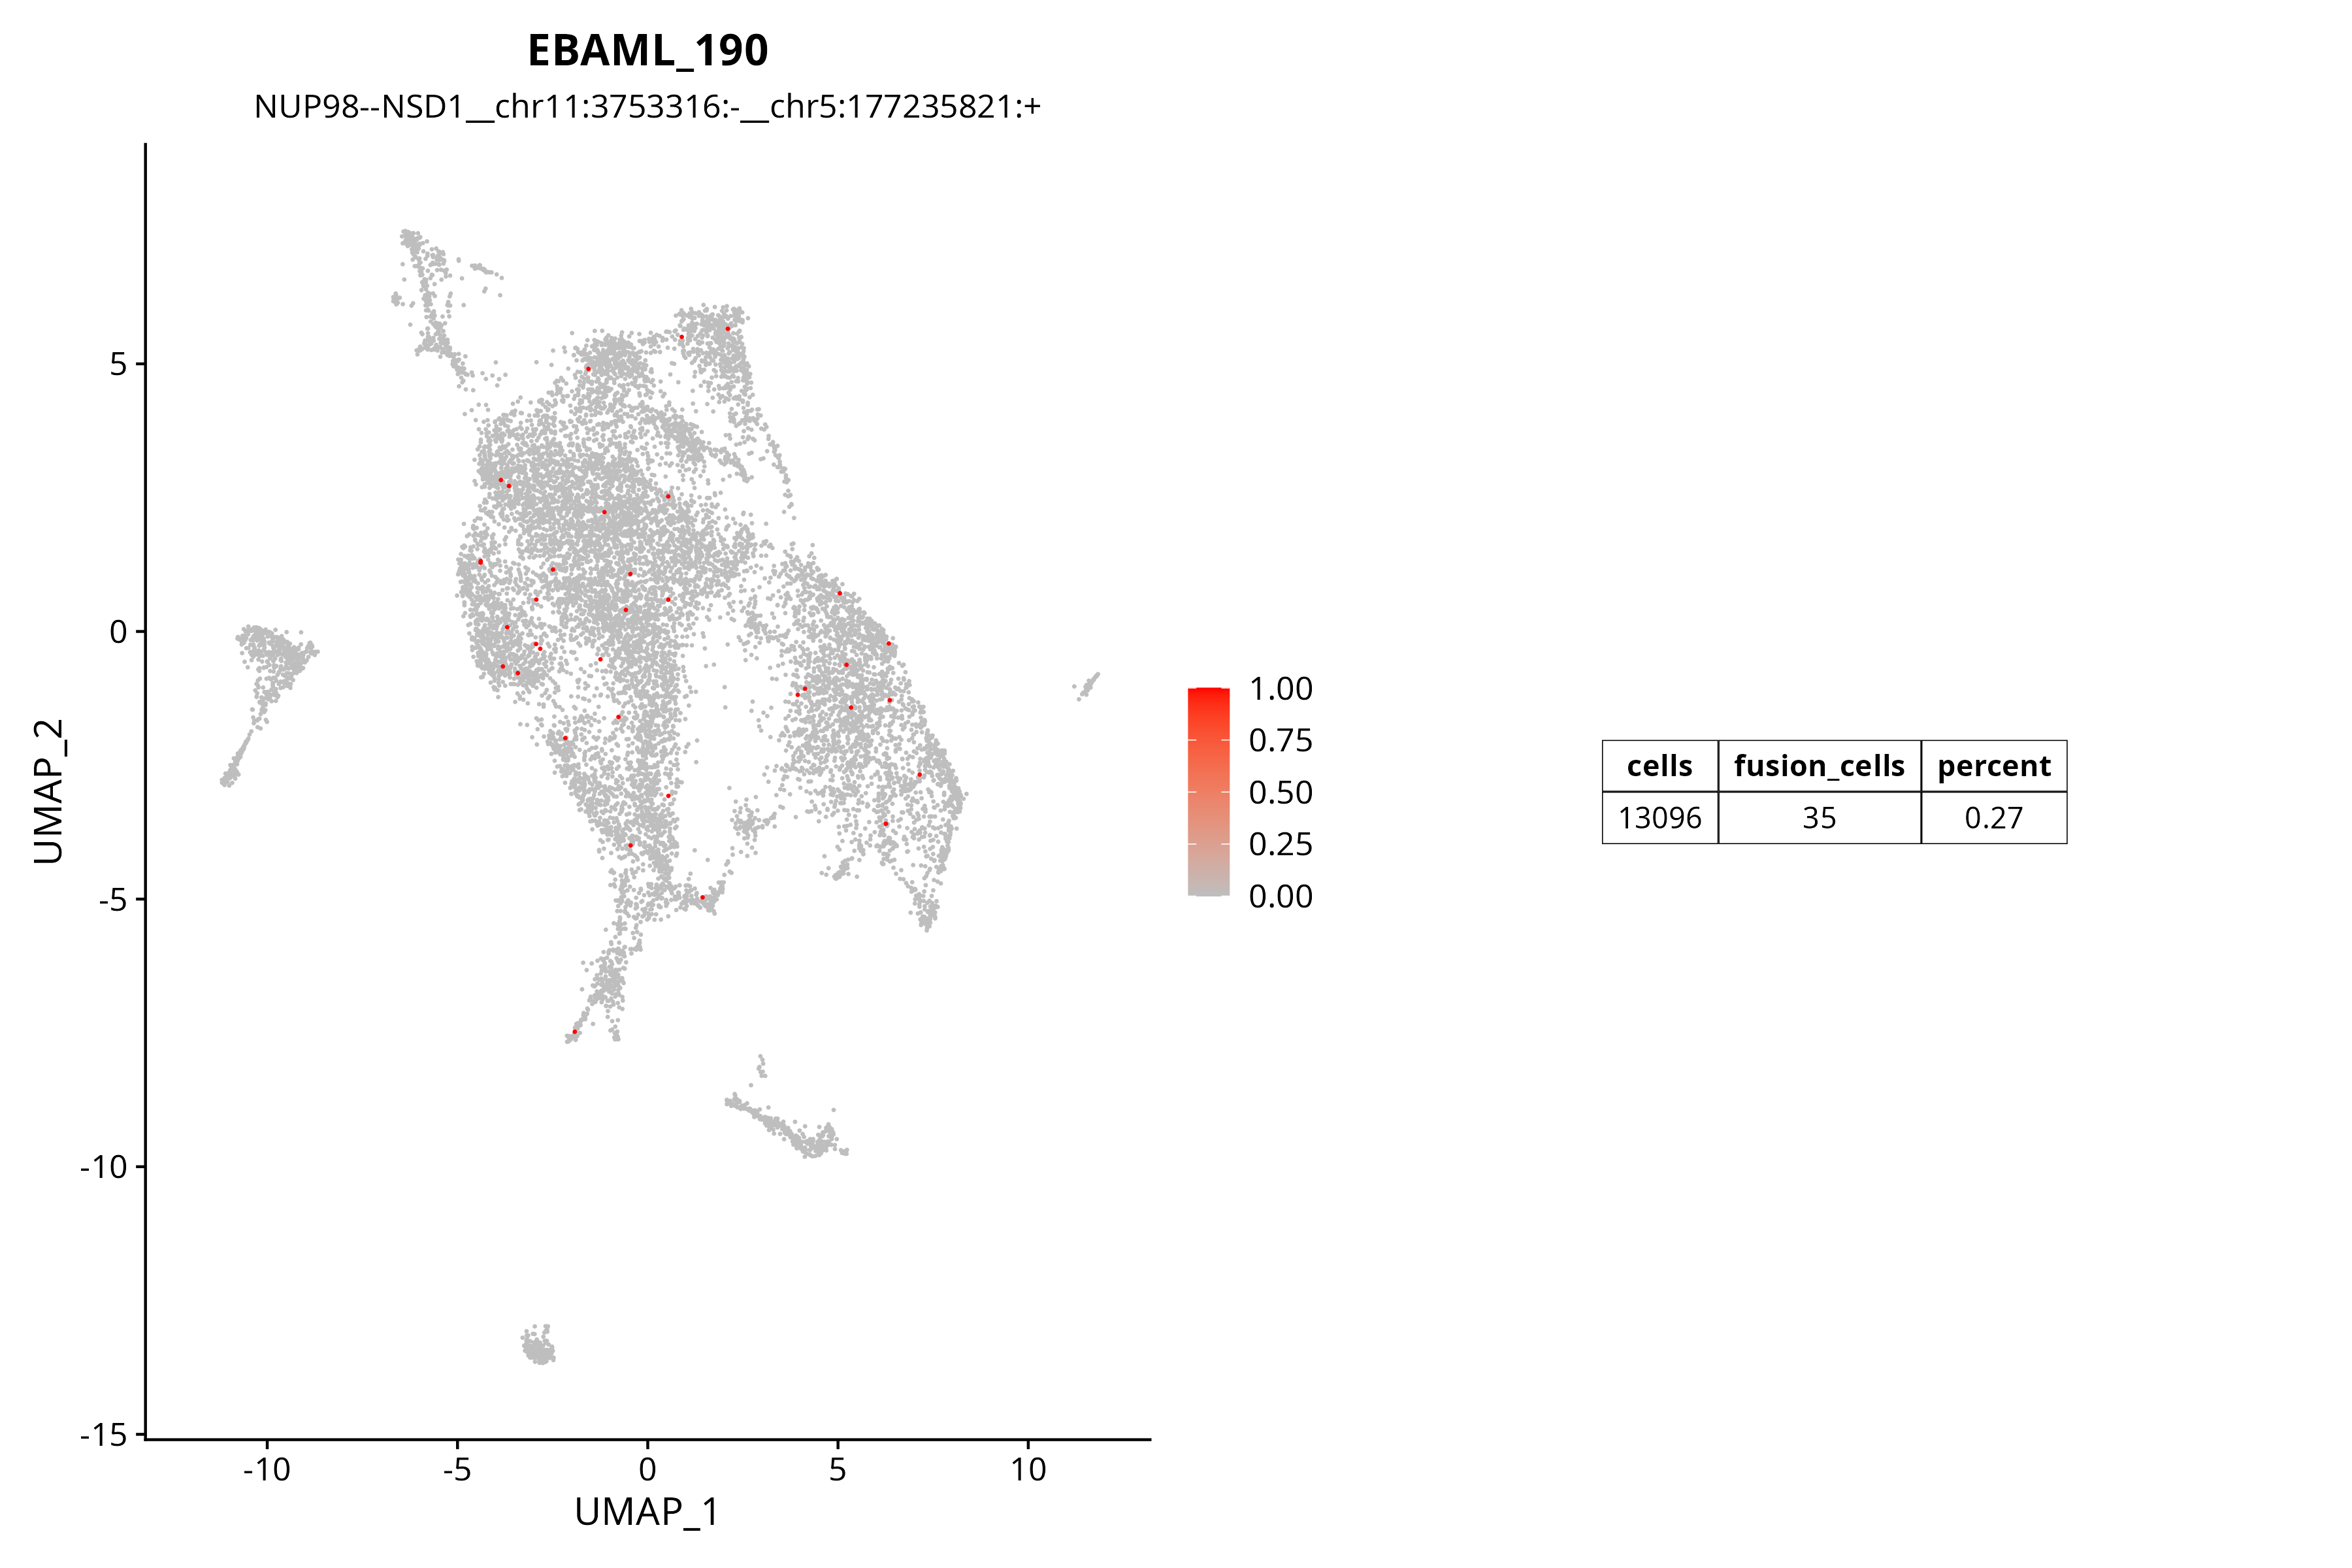
Fusion Gene UMAP Distribution Plot
The figure below shows the distribution of the NUP98--NSD1 fusion gene in a single-cell population. Color intensity represents UMI count, with red indicating cells highly expressing this fusion.
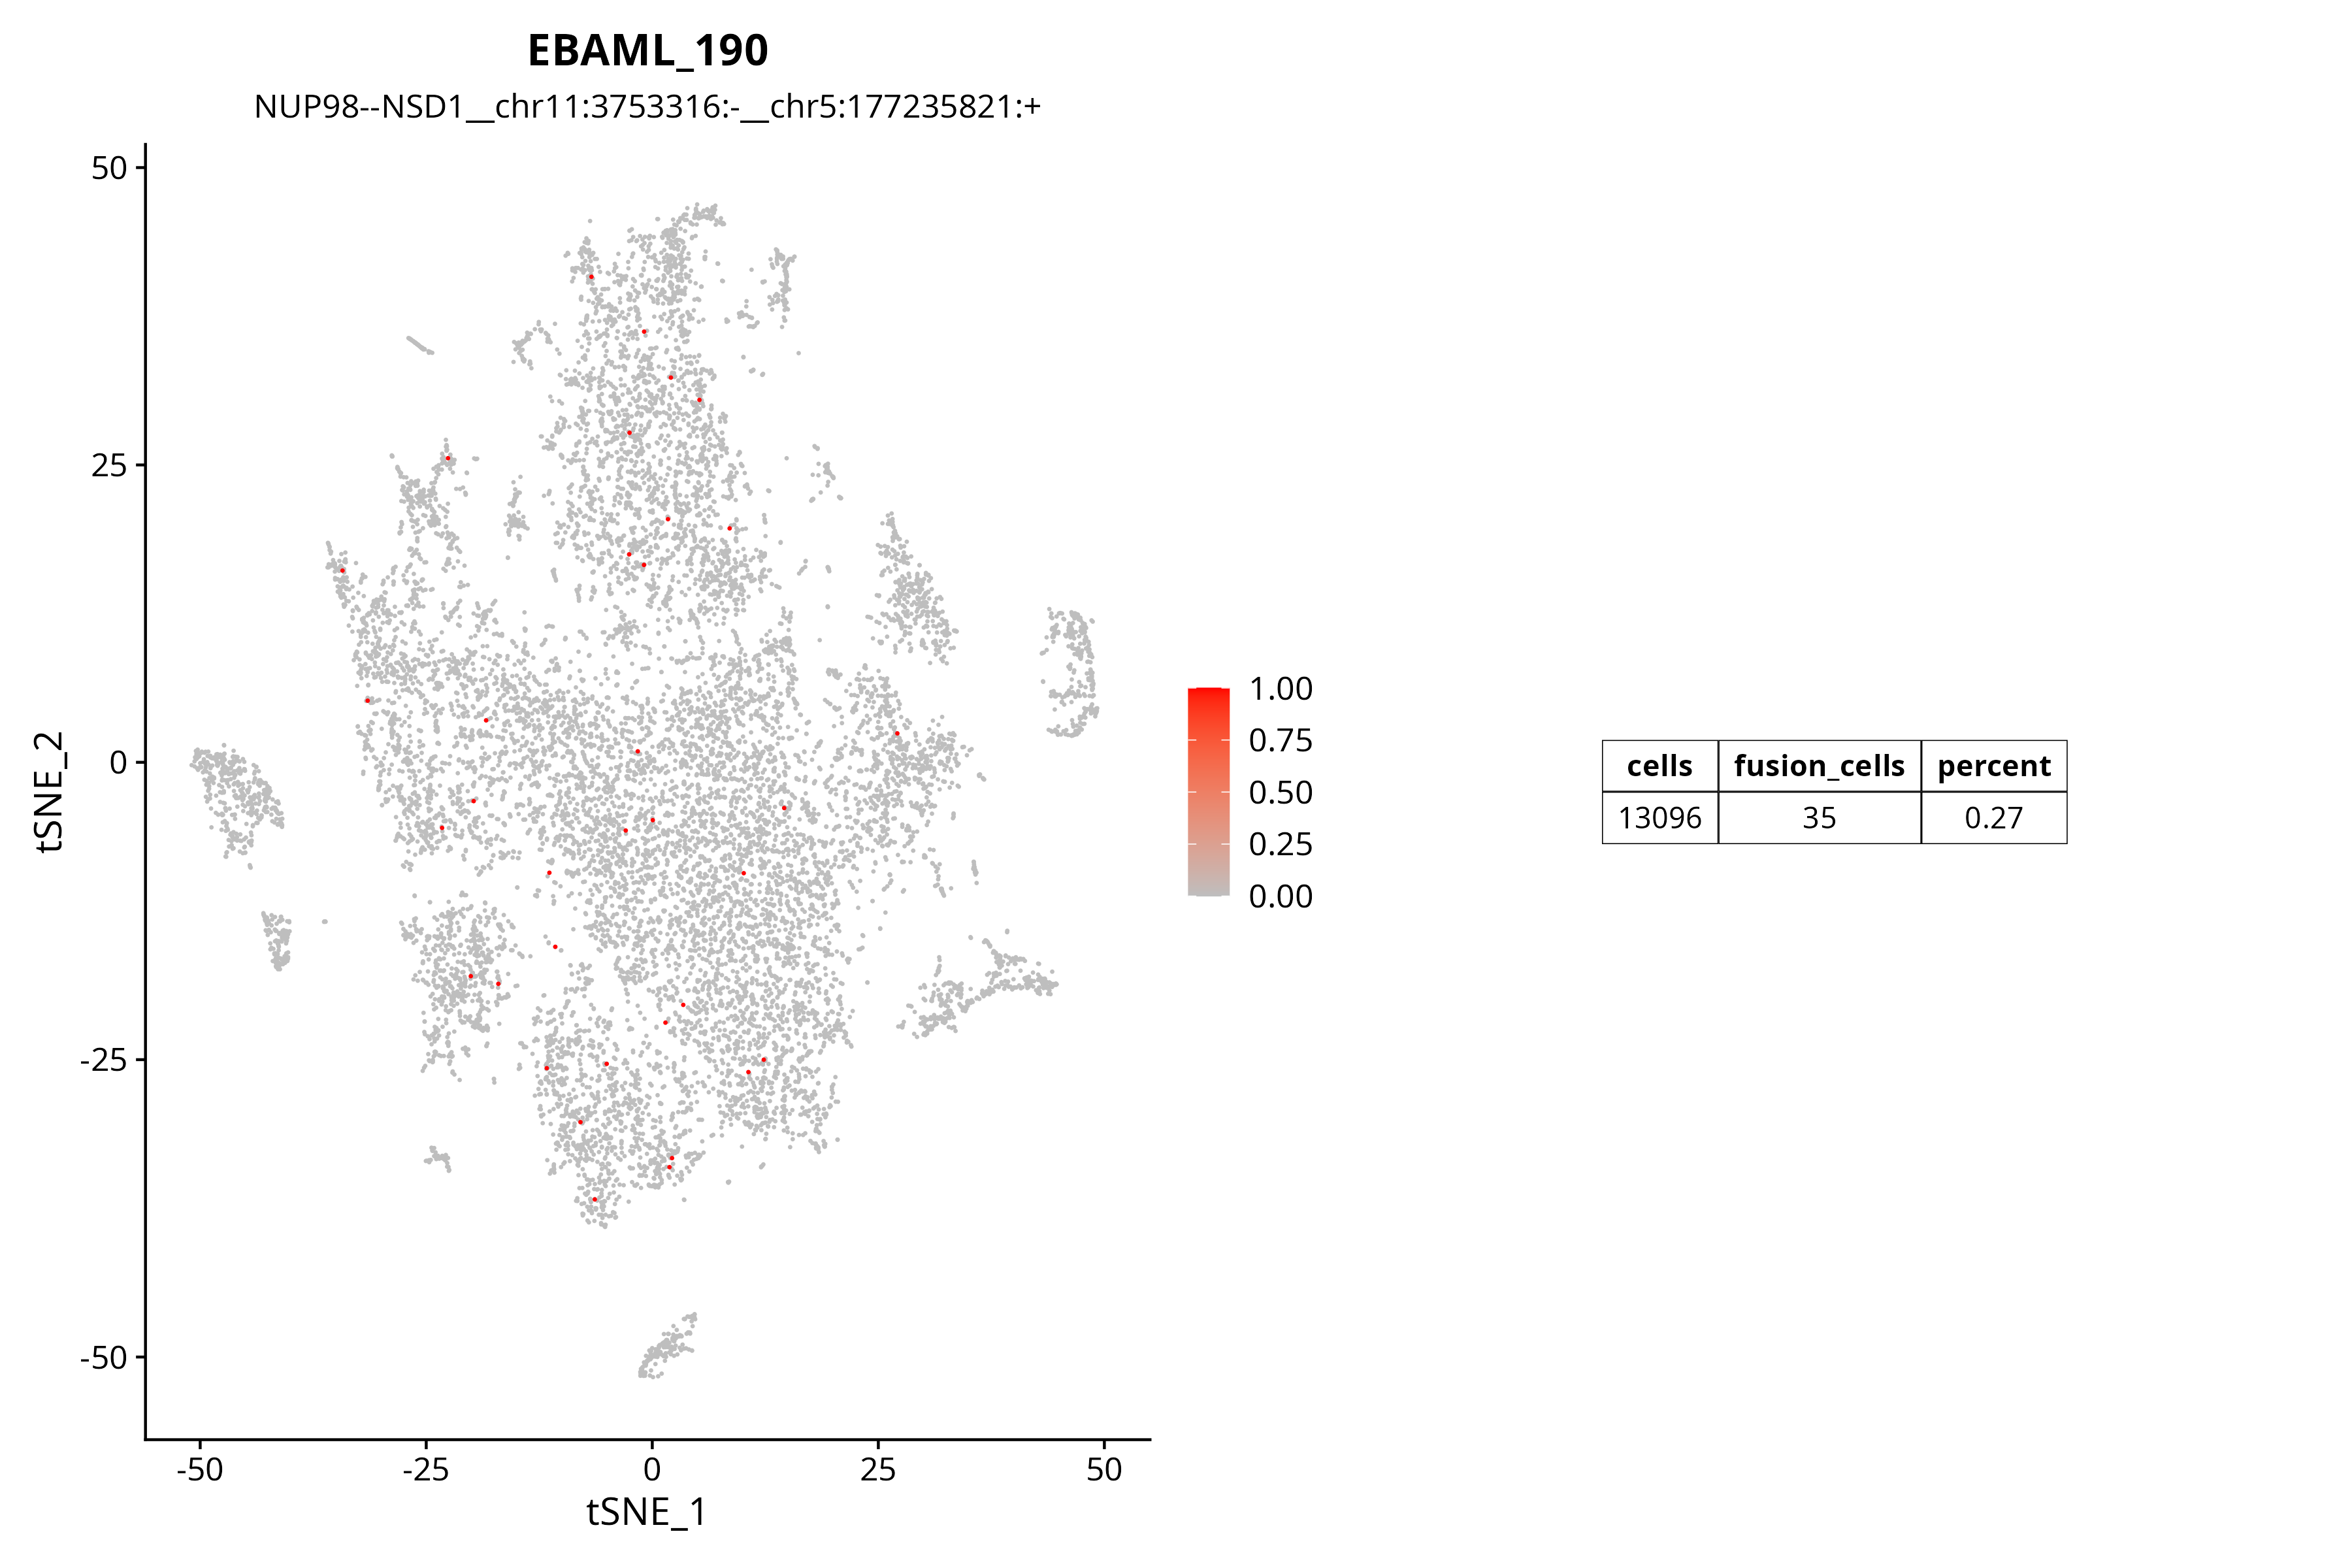
Fusion Gene TSNE Distribution Plot
TSNE plots provide another visualization perspective, helping to identify distribution patterns of fusion genes across different cell subpopulations.
Biological Significance Interpretation
- Functional Classification: Based on annotation information of fusion genes (e.g., NUP98:Oncogene), assess their potential roles in cellular biological processes.
- Cell Specificity: Analyze distribution patterns of fusion genes across different cell types to determine their cell-specific expression.
- Fusion Type Analysis: Predict structural and functional characteristics of fusion proteins based on fusion breakpoint positions and protein fusion types.
- Database Correlation: Obtain clinical and biological information about known fusion events through comparison with databases such as Mitelman and ChimerKB.
Case Reference
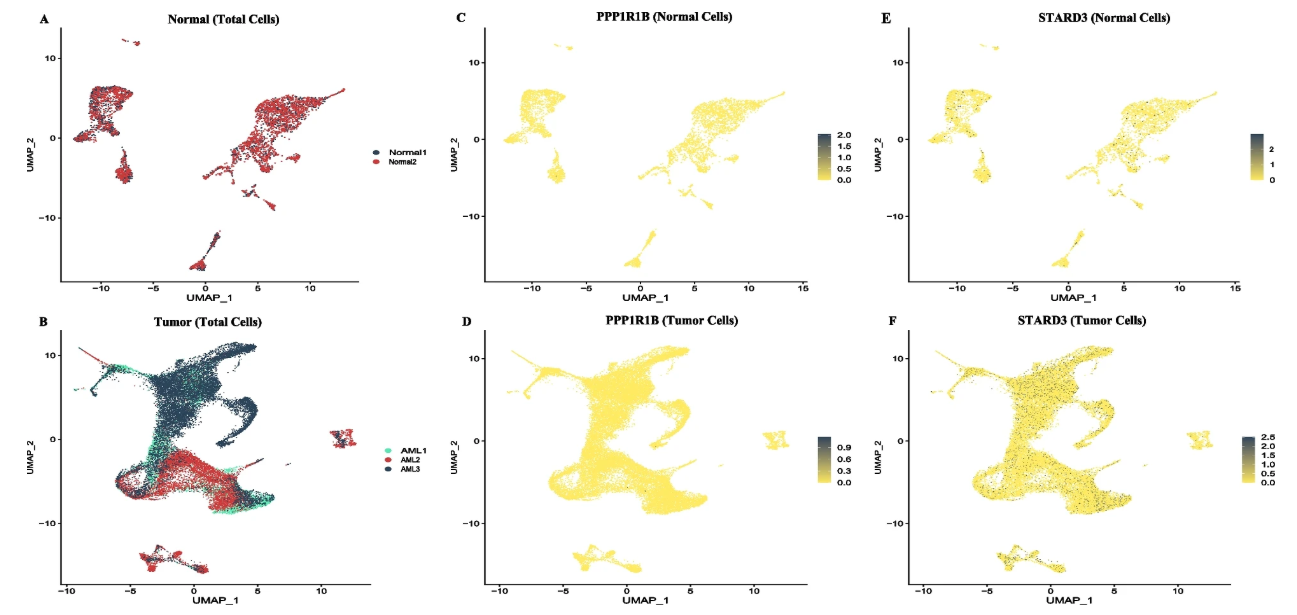
The analysis results from the Fusion module can be widely applied in various research scenarios, particularly valuable in leukemia research. Taking the PPP1R1B::STARD3 fusion as an example:
- Novel Fusion Gene Discovery: The PPP1R1B::STARD3 fusion was first reported in acute myeloid leukemia (AML). Through single-cell Fusion analysis, it is possible to precisely locate cell populations carrying this fusion and understand its distribution pattern in tumor heterogeneity.
- Therapeutic Target Discovery: This fusion gene involves cholesterol metabolism and the PI3K/AKT signaling pathway. STARD3 is involved in intracellular cholesterol transport, and PPP1R1B functions as an oncogene in various solid tumors. Its fusion product may become a new therapeutic target.
- Disease Diagnostic Biomarker: This fusion gene is specifically expressed in AML patients but not reported in B-cell acute lymphoblastic leukemia (B-ALL), showing potential as an AML diagnostic biomarker.
The recommended practical approach is:
- Fusion Screening: Use indicators such as supporting read counts and FFPM in the fusion gene table to screen for high-reliability fusion events.
- Cellular Localization: Through UMAP/TSNE visualization, determine the distribution of fusion genes across different cell populations.
- Functional Annotation: Combine database annotation information to assess the biological significance and potential functional impact of fusion genes.
- Validation Experiments: Conduct subsequent experimental verification for important fusion events using techniques such as RT-PCR and FISH.
Notes and Best Practices
WARNING
Fusion gene detection results may contain false positives and require screening using multiple indicators such as JunctionReadCount and LargeAnchorSupport. For important fusion events, experimental verification is recommended.
- Data Quality Control: Ensure good input data quality through quality control tools like fastp to filter low-quality reads and improve the accuracy of fusion detection.
- Parameter Optimization: Reasonably adjust analysis parameters according to specific research needs, such as species selection and filtering thresholds.
- Result Verification: For important detected fusion events, experimental verification using methods such as RT-PCR and Sanger sequencing is recommended.
- Biological Interpretation: Combine existing literature and database information for in-depth biological interpretation of fusion events, avoiding over-interpretation or misinterpretation.
Frequently Asked Questions (FAQ)
Q: How to assess the reliability of fusion genes?
A: Mainly refer to the following indicators: high JunctionReadCount and SpanningFragCount, presence of LargeAnchorSupport, normal Left/RightBreakEntropy values (typically between 1.5-2.0), having known biological function annotations, etc.Q: Why are some fusion events distributed scatteredly on UMAP/TSNE plots?
A: This may be because the fusion event is expressed in multiple cell populations or there is high cellular heterogeneity in the sample. It needs to be explained in combination with the specific biological context.Q: How to distinguish between true fusion genes and false positives?
A: In addition to focusing on statistical indicators, you can also refer to the following points: whether the fusion gene is recorded in multiple public databases, whether the breakpoint is located in an intronic region and conforms to GT-AG splicing signals, whether the fusion product has potential biological functions, etc.Q: Is it normal to find a large number of mitochondrial gene-related fusions in the analysis results?
A: Fusion events involving mitochondrial genes (starting with MT-) are relatively common, but many may be false positives caused by technical reasons. It is recommended to filter in combination with annotation information and biological knowledge, focusing on fusion events related to known diseases.
References
- Haas, B.J., Dobin, A., Li, B. et al. Accuracy assessment of fusion transcript detection via read-mapping and de novo fusion transcript assembly-based methods. Genome Biol 20, 213 (2019). https://doi.org/10.1186/s13059-019-1842-9.
- Haas B, Dobin A, Stransky N, et al. STAR-Fusion: Fast and Accurate Fusion Transcript Detection from RNA-Seq. 2017. DOI:10.1101/120295.
- Kumar-Sinha C, Tomlins SA, Chinnaiyan AM. The emergence of gene fusions as biomarkers and therapeutic targets. Cancer Discov. 2015;5(1):36-47. doi:10.1158/2159-8290.CD-14-1014.
- Detection of novel PPP1R1B::STARD3 fusion transcript in acute myeloid leukemia: a case report. 2023. Case Report. doi:10.1186/s13256-024-04536-w.